Understanding light, and its connections to electricity and heat is the central theme of Protons for Breakfast. And a primary tool for understanding light is the spectrometer. So at Protons‘ we give out diffraction grating glasses (above) which split light into its component frequencies, each of which we perceive as having a different colour. These are big hit.
We become more quantitative too by using hand-held plastic spectrometers (link or link) that display the spectra against a wavelength scale. And brilliantly conceived and simple though these are, they are tricky to use. And although they give a quantitative measure of the wavelength of light, they give no information about the relative intensities of the different wavelengths.
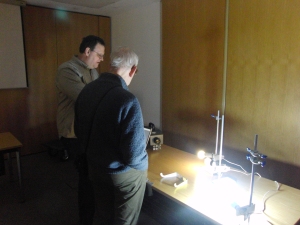
It turns out be difficult (=expensive) to get accurate information on the relative intensities of light at different wavelengths. But my colleague John Mountford noticed that an instrument for doing this was temporarily available, and so we took it along to Protons and tried it out. The results were very impressive and below I have put three screenshots of the light from three types of lamps: conventional incandescent, compact fluorescent, and the new fangled LED lamps. Each spectrum is strikingly different and to the physics detective, tells the tale of how the light is made. I will be looking at each of these three lighting technologies in future weeks, but for now just enjoy this beautiful data. If you would like to plot your own graphs, you can download an Excel spreadsheet containing spectroscopic data.

The spectrum of an incandescent light bulb. Notice that the bulb gives out mainly red and infra red light. The bulb appears yellow to us because we are insensitive to red light and the small amount of blue, and detect primarily the green and yellow. Click for enlarged image.


